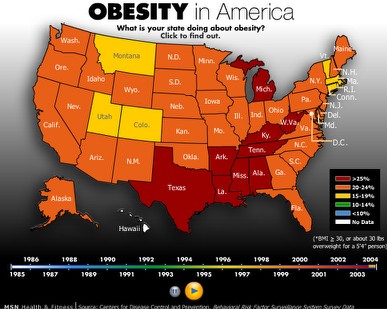
This map shows the increase of obesity rates in the U.S. from 1985 - 2004. It is pretty remarkable the rate of obesity over the last twenty years, frightening actually. What is going on? Are we living in our cars and in front of our machines? Eating out more? Getting little exercise?
I'm going to stop now and hit the gym? Yikes!
Obesity in America - MSN Health & Fitness
↧
Animated Obesity Map of the U.S.
↧